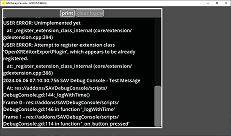
SAV Debug Console GODOT


Available now on github

Hopefully coming soon! Download from the GODOT Asset Library


Runtime ("in app") Debug Console for GODOT

Works with both GODOT logs and Android Logcat output

SAV Debug Console is a flexible and light weight GDScript that creates a runtime debug console display that you can add to almost any GODOT application

Display at runtime ("in app") the log output from the print, print_debug and print_stack methods or logcat

SAV Debug Console is a work in progress

GODOT Build 4.2

Display in windows and Quest:


Features:
  • GDScript supports all GODOT platforms
  • Supports XR (AR/VR)
  • Android support for logcat
  • Clear logcat button
  • Scrollable window
  • Easy to use and modify


Available now on github

Hopefully coming soon! Download from the GODOT Asset Library

SAV Debug Console QuickStart:

Other than XR:

  1. Instantiate Child Scene
  2. Search for and Open the SAVDebugConsole scene (addons\SAVDebugConsole\scenes\SAVDebugConsole.tscn)
XR:

1. Add a Viewport2Din3D2 (godot-xr-tools)
2. Locate the SAVDebugConsole scene (addons\SAVDebugConsole\scenes\SAVDebugConsole.tscn)
3. Drag the SAVDebugConsole scene in to Viewport2Din3D2's Content/scene


SAV Debug Console Settings:

Other than XR:
  1. Located in the inspector for the SAVDebugConsole element
XR:
  1. In the Viewport2Din3D2's Content/scene, Click the "Open Scene"
  2. Adjust in the inspector for the SAVDebugConsole element
BOTH:
Console Entries Max : int = 100
  • max number of entries in the list
    • console_entries_max above 100 can cause performance issues
    • must be an integer > 0

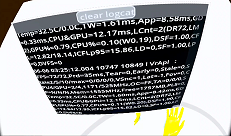
Logcat : bool = false
  • Switch between GODOT logs and logcat output
    • True = logcat logs


SAV Debug Console additional help:

Some messages are displayed partially
Hard to scroll when new logcat entries cause scroll to the bottom
Unknown behavior if GODOT log rotates